Announcing Qovery Observability: the simplest way to understand your application
We are thrilled to announce the next major milestone in our platform vision: Qovery observability!
Qovery Observability is our new product, ready to give you the fastest way to gain a crystal-clear, unified understanding of your application and infrastructure. Fully managed, you keep the data, no more tool switching. Coming soon!

Alessandro Carrano
June 17, 2025 · 5 min read
Alessandro Carrano
Alessandro is the Lead Product Manager at Qovery, ex Doctolib and Criteo
See all articles#What are we talking about
This is our developer-first observability product that brings everything you need into a single, unified view, completely integrated into our platform.

Thanks to the work we’ve been doing over the past years on our infrastructure management and CI/CD product, you can trace an issue from a failing pod to a recent configuration change, a network spike, or a service deployment, and even get alerted before customers notice anything without switching tabs or chasing down disconnected dashboards.
It is fully integrated into our platform and it provides metrics, events and logs across your entire stacks in a clean, powerful interface that lets you move from high-level views to granular details in seconds.
And the best part? It’s fully managed. No maintenance, no glue code, no integration headaches. Just one click and you get the data all in one place.
#Why are we doing this
Multiple great solutions have been created over the past years around observability, but they all have drawbacks. Here are the options today:
Option 1: Commercial monitoring tools (Datadog, New Relic, etc):
While installing these solutions with Qovery is a 5-minute job, they offer no seamless integration with your existing tooling and processes: important data and actions are spread across multiple boards/tools (logs, metrics, deployments, application configuration, etc), and it becomes hard to correlate them. Moreover, you lose control of your data (since it is stored outside of your infrastructure), and one of the most frustrating parts is the pricing unpredictability.
Option 2: Open source monitoring tools (Grafana/Prometheus, Alertmanager, etc) :
While they come for free on paper, installing and maintaining these solutions becomes pricier when you’re not an expert. This usually translates into involving/hiring a DevOps engineer who will install and maintain the stack for you. Last but not least, like commercial monitoring tools, these solutions do not offer seamless integration with your existing tooling and processes.
So in the end, no matter the solution you chose, debugging the smallest issue becomes an Odyssey: opening multiple dashboards (application logs, deployment history, nginx metrics, application metrics, etc), waiting for DevOps to share access to metrics, switching between tools to fix your issue and trying to correlate logs and metrics manually. When you think you’ve found the root cause, you’ve probably had your service down for hours, or the root cause is already outdated.
We built Qovery Observability to put an end to that: we have designed Qovery Observability to remove the mentioned developers' pain points and make sure that every developer can debug any application and infrastructure issue in seconds, not hours.
This product is strictly related to Qovery’s vision to empower developers with autonomy and confidence. It brings observability directly into their hands and helps shift infrastructure ownership left, closer to those who build and ship the software.
#How do we solve this (and why it’s wild 🔥)
At Qovery, we have built this additional layer in our platform to provide you with:
- 🔎 Unified view: Logs, metrics, and events correlated all in one place. No tab juggling nor context switching. Your application, infrastructure, and Qovery data all in one place.
- 🧩 No context switch: Everything happens inside the Qovery console. You can deploy your applications, monitor their logs and metrics, and manage your infrastructure.. all in one place, all your tools speak the same language.
- 🚨 Smart, integrated alerting: Get proactive alerts with notifications via UI, Slack, and email.
- 🧘♂️ Developer autonomy: Built into the Qovery UI. Your devs don’t need to wait for anyone for the setup or to troubleshoot. No DevOps intervention.
- 📦 Fully managed: Qovery install, maintain, and update the whole stack for you. You don’t even need to know how it works (unless you want to).
- 🌐 Open source foundation: Powered by OSS tools you trust and widely used in companies (Prometheus, Thanos, Loki), without the pain of integrating and maintaining them yourself.
- 🔐 Data Ownership: Everything is stored in your cloud account, under your control. And the data retention is configurable.
- 💰 Transparent Pricing: No surprise bills, no fancy pricing based on data retention or ingestion.
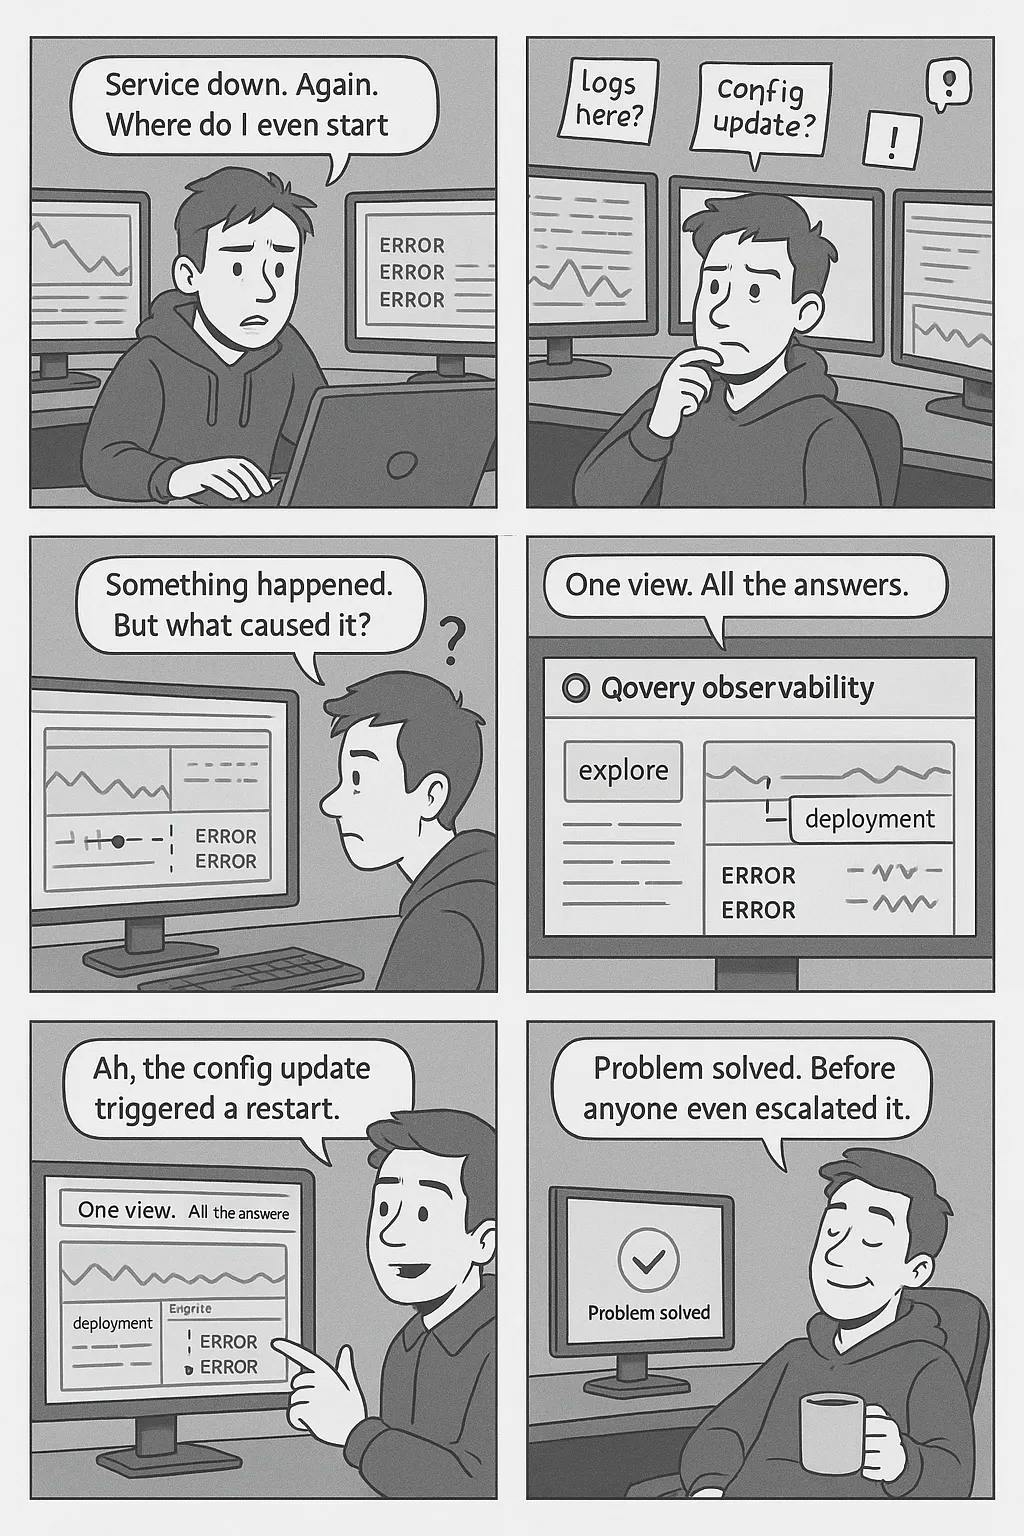
#A concrete example
Let's say your checkout API suddenly starts returning 503s:
- Alerting phase: Your developer gets alerted instantly, not by a customer but by Qovery Observability, which detects a spike in error rates and provides some information on the ongoing issue: impacted service, diagnosed error, and since when.
- High-level investigation phase: Via the link provided in the alert, they open the Qovery dashboard and immediately see a pattern of application instance restarts. A quick glance shows these restarts began right after the last deployment that happened two hours ago (pulled directly from Qovery's deployment history). They can see that the version of their application has changed between the two releases.
- Low-level investigation phase: With one click, they access the application logs scoped to the impacted pod right before it restarts.
- Root cause identification: The root cause is identified: the new application version is looking for an asset that doesn't exist in production. They quickly roll back the version with Qovery and work later on the fix. All within minutes.
#🙌 Join the developers’ revolution
Qovery Observability is about to change the way you ship and run software. It’s simple, powerful, and puts developers in control.
We’re rolling it out soon. Want early access? Want to see a demo?
👉 Contact your CSM!
You're not yet a customer and want to know more about Qovery?
👉 Sign up
Your Favorite DevOps Automation Platform
Qovery is a DevOps Automation Platform Helping 200+ Organizations To Ship Faster and Eliminate DevOps Hiring Needs,
Try it out now!
Your Favorite DevOps Automation Platform
Qovery is a DevOps Automation Platform Helping 200+ Organizations To Ship Faster and Eliminate DevOps Hiring Needs,
Try it out now!